VExD contains gene expression experiments of human cells or tissues that have been infected by viruses. Experiments are curated from the Gene Expression Omnibus. There are several ways to browse this database:
Enter a gene symbol, Ensembl human gene ID (beginning with ENSG), or RefSeq ID (beginning with NM_) into the textbox. As you type, a suggestion list will pop up, which you can select from with the mouse or using the arrow keys and Enter.
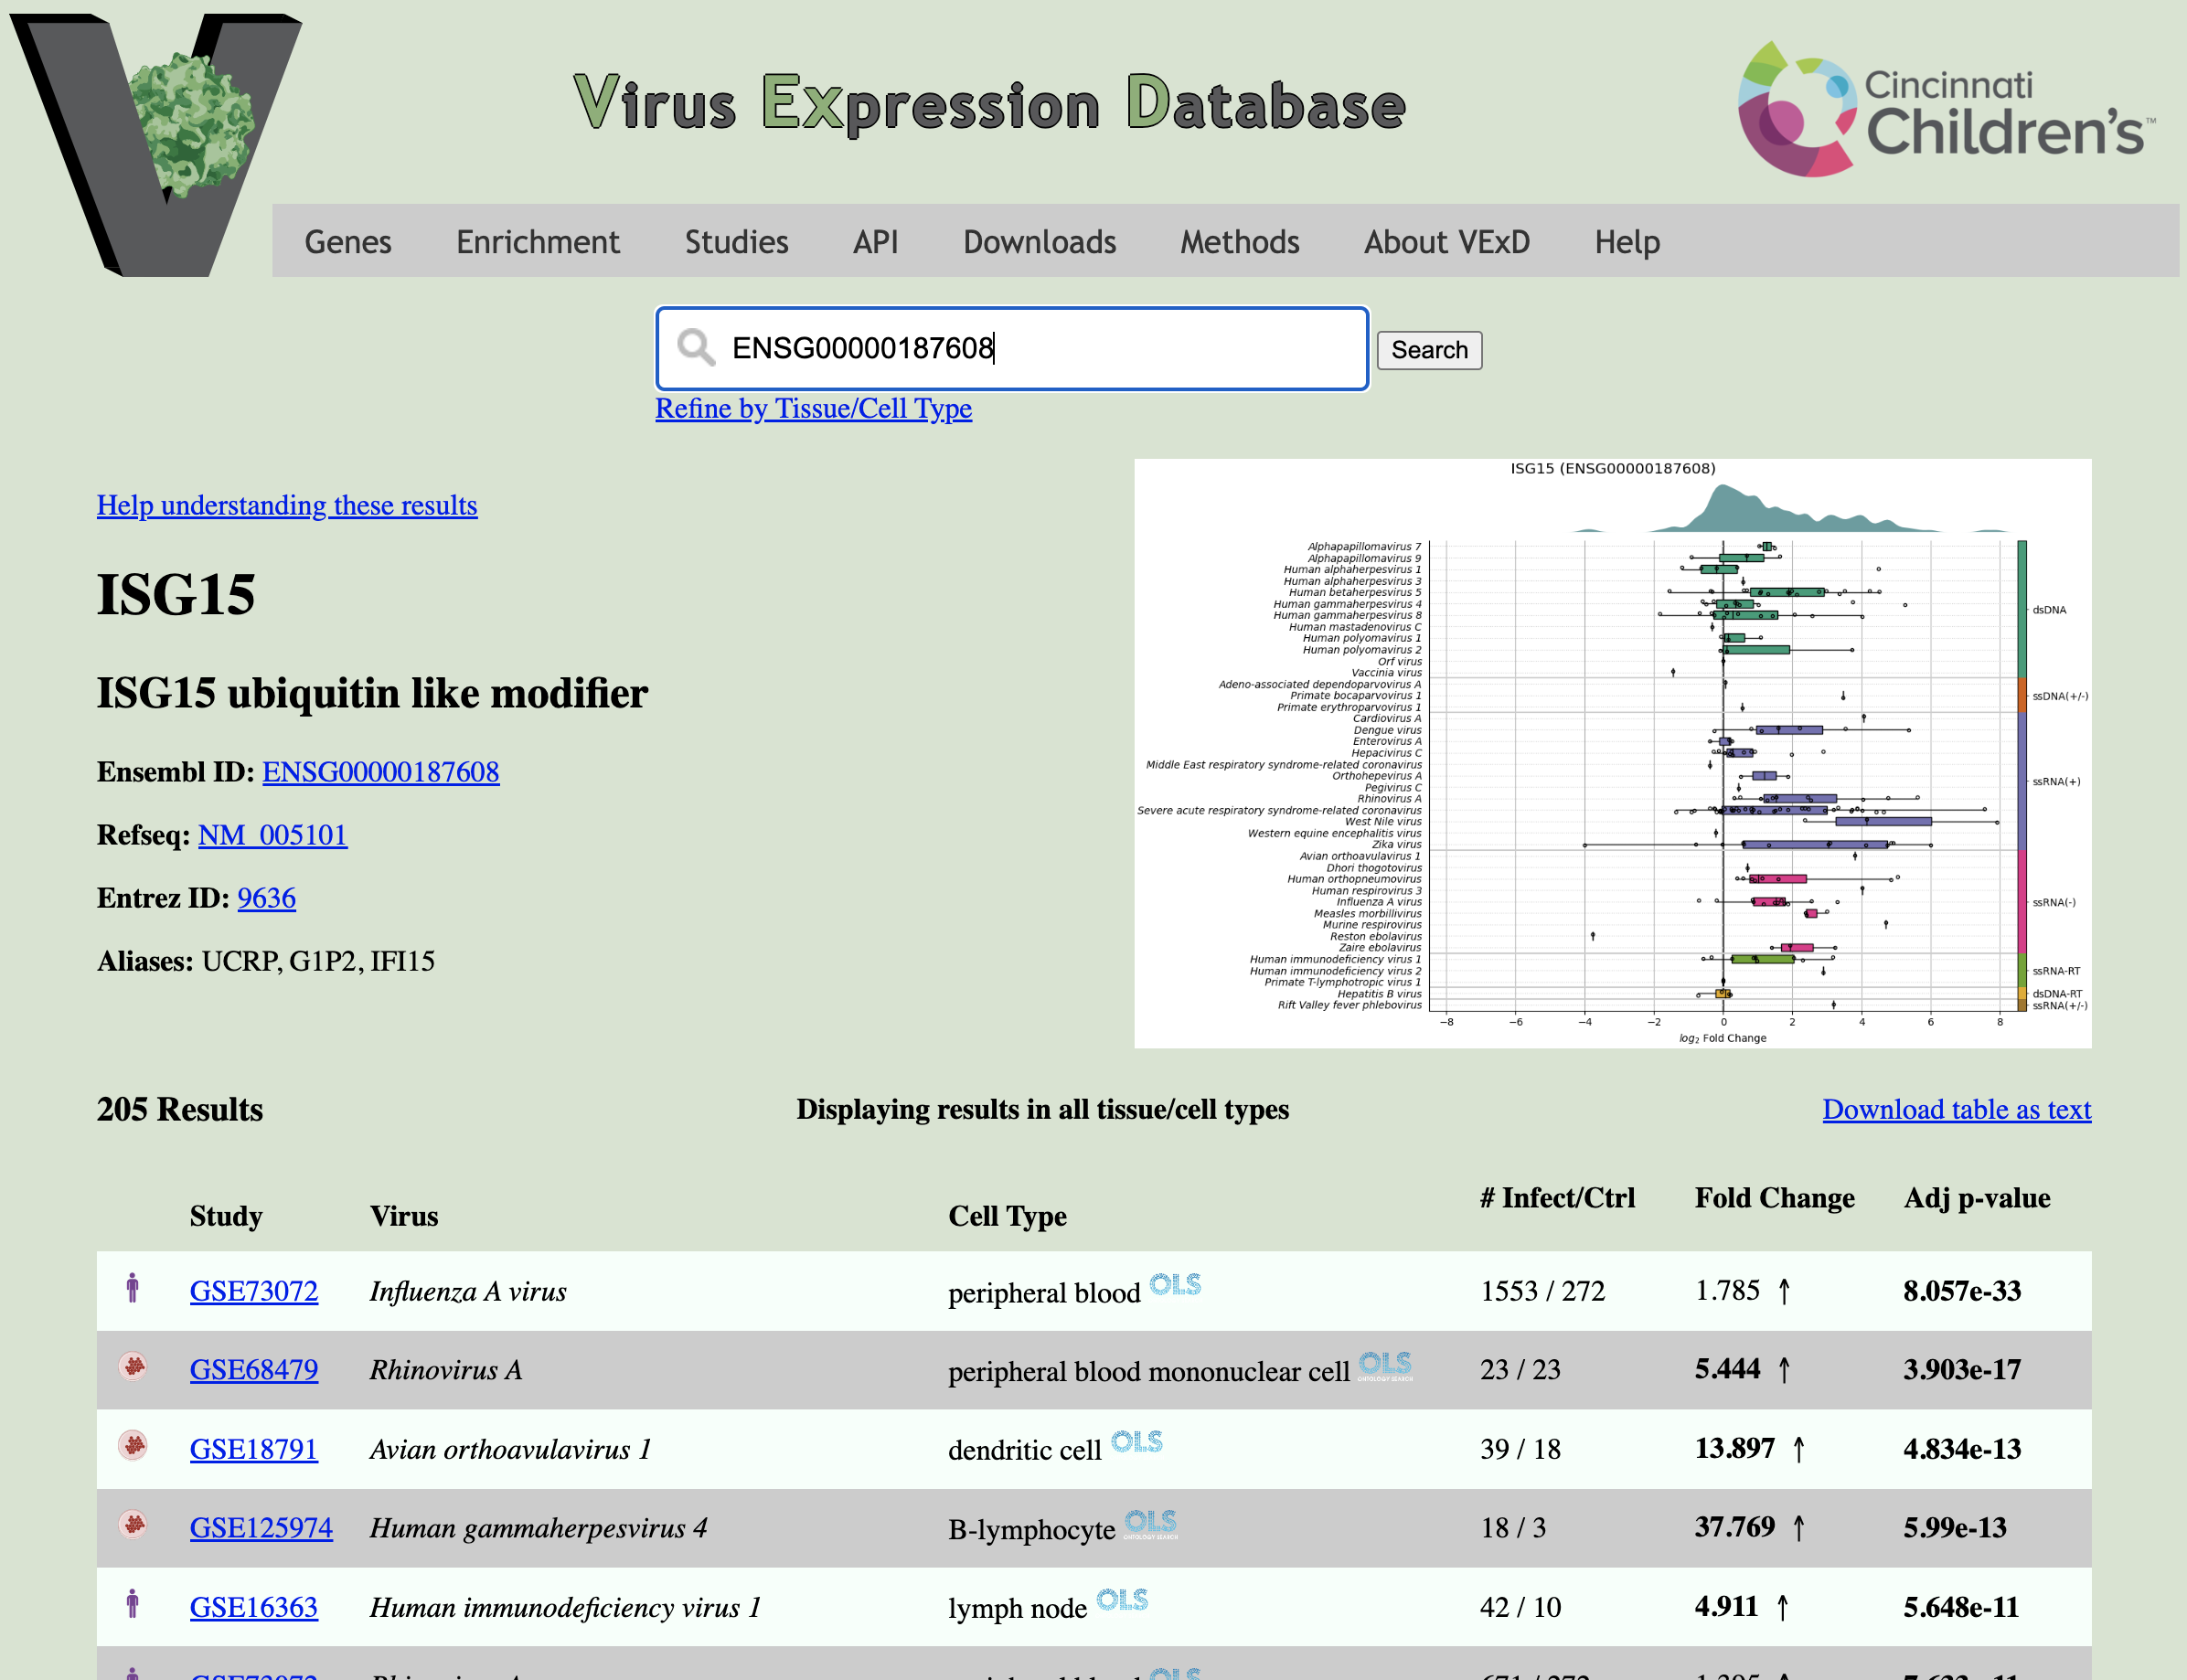
The gene search result page (example to the right) contains four major areas:
Search Bar (Top): Allows you to quickly search for a different gene. The "Refine by Tissue/Cell Type" link exposes a text box which allows you to show a subset of results, based on the assayed cell type. This control works identically to the box on the Study Search page.
Gene Information (Left side): Displays the name of the gene, aliases, and links to common gene databases.
Result Table (Bottom): Displays the fold change and adjusted p-value for this gene in every comparison in VExD. Click the column headers to sort. Fold changes more extreme than 2-fold and p-values less than 0.05 are displayed in bold.
Overview Figure (Right side): A graphical overview of the expression of this gene in VExD. This dynamically generated figure takes a second or two to load. Click to expand.
Within the figure, each row represents a virus (sorted and colored by Baltimore family, right colorbar), and the x-axis shows the log2 fold change. Each point shows the expression of the given gene in a single experiment, summarized in the boxplot overlay. The green shape at the top of the figure shows a density plot of all results.
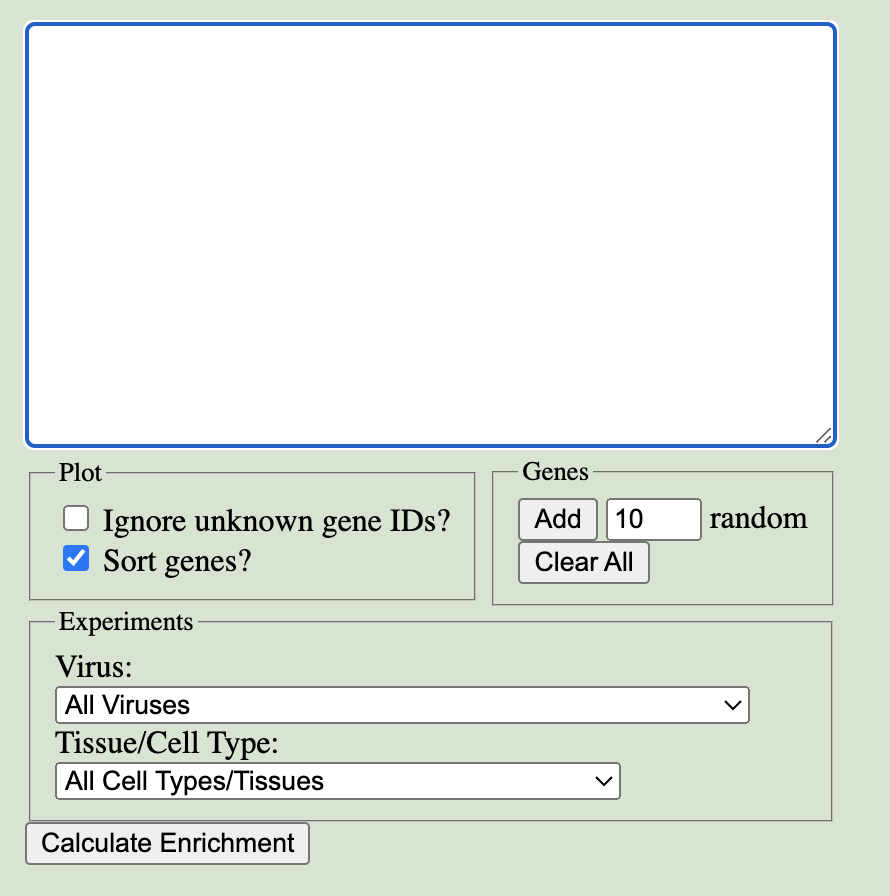
Enter the list of genes you'd like to query in VExD in the main text box. Up to 150 genes can be entered, specified as gene symbols, Ensembl IDs, or RefSeq IDs. Genes may be separated by newlines, spaces, commas, semicolons, or any combination of these.
In the Plot box, you can:
The Genes box helps you manage your gene list:
Finally, you can filter the Experiments to enrich the gene set in by both Virus and Tissue/Cell Type.
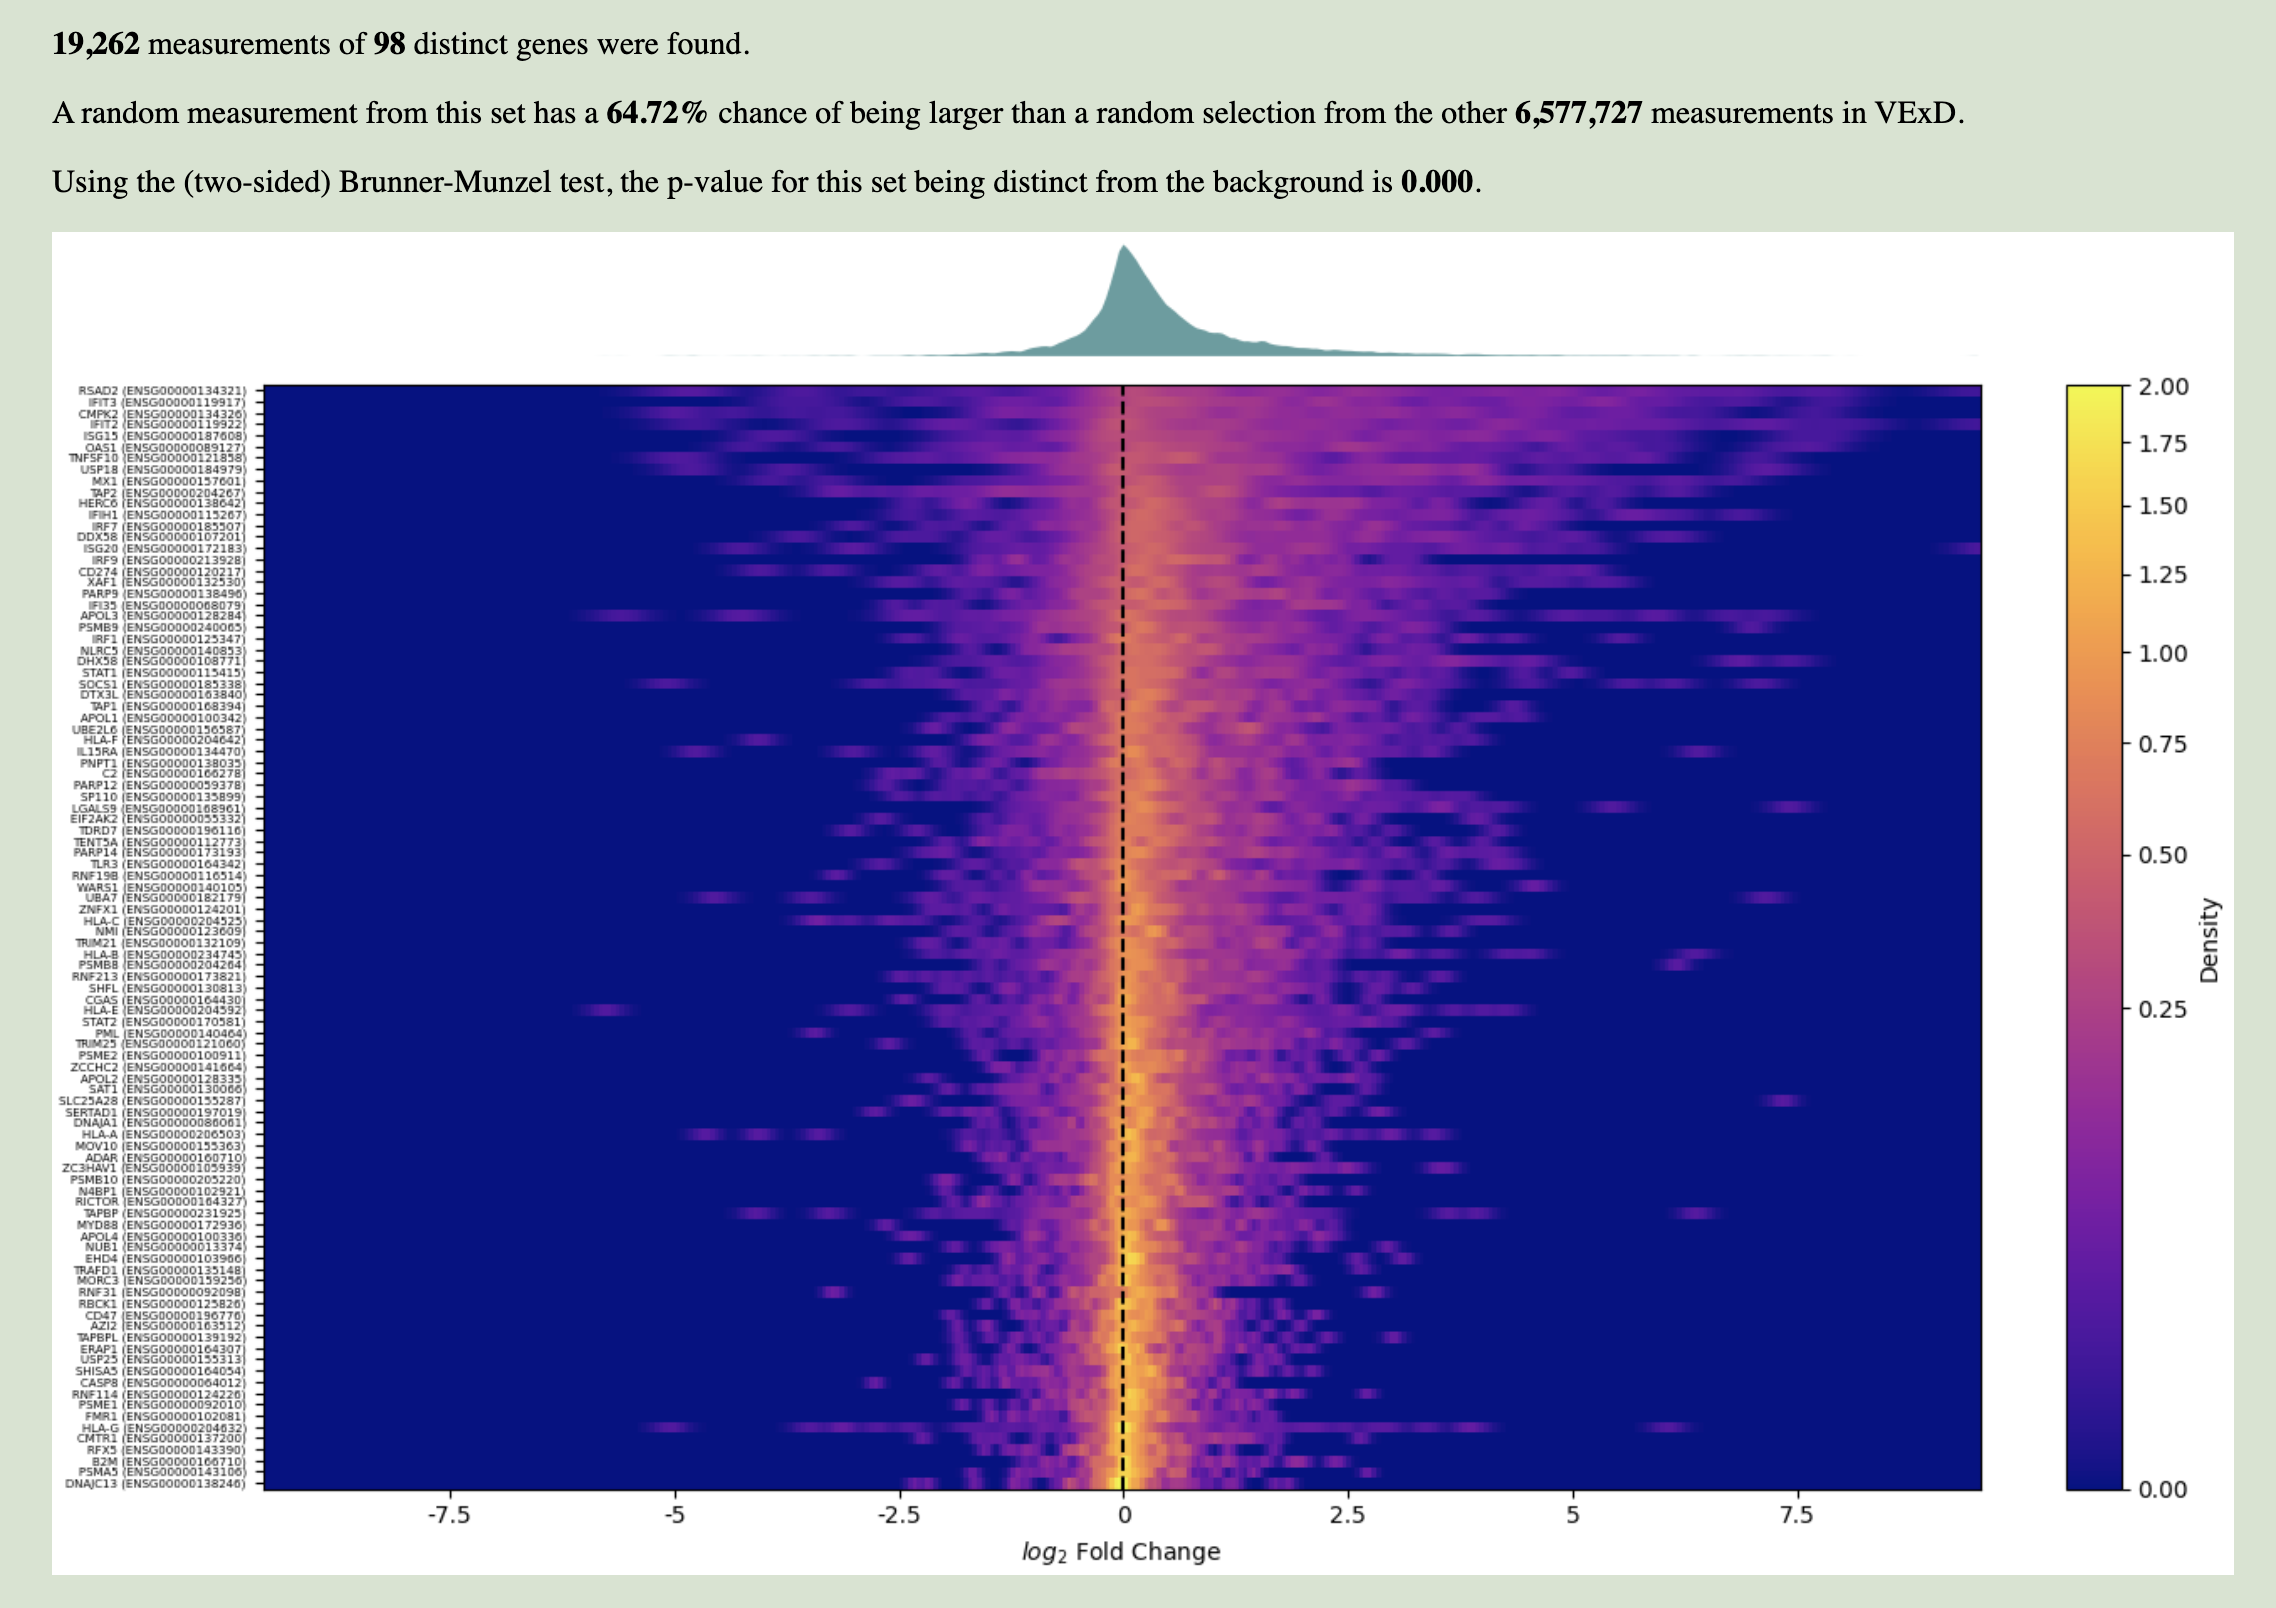
A few seconds after clicking "Calculate Enrichment", the page will automatically scroll so that enrichment results are in view. These results compare the expression of the genes you specified to the expression of every other gene, all in the experiments using the virus and tissue/cell type specified.
The text at the top describes the statistical results of enrichment:
In the figure at bottom, the distribution of input gene expression values are represented. Each row is an input gene, and the x-axis shows log2 fold changes. Each row is colored by the density of input measurements — brighter colors indicate that more measurements show the associated fold change. This allows you to assess whether a gene is generally up- or down-regulated (bright spots right or left, respectively, of the center line), and how consistently it behaves across experiments (whether it's a sharp point or a smear). Above the heatmap is a density plot of all input measurements, which helps in finding subtle shifts.
You can search for studies by specifying either the virus or the cell type used in the experiment:
Results from a study search are listed in a table, with each row representing a single differential expression analysis. Analyses were performed within each study, while matching the virus, cell type, and platform. This makes it extremely common for studies to have multiple analyses, because they queried multiple cell types for instance. Results are ordered by the number of significant genes found. You can click the Download table as text link at the top to get the results page as a tab-separated text file.

Each line of the results table summarizes an analysis. From left to right, the columns tell you:
Here are some tips for specifying cell type or tissue. The "Show Tissue Tree" option described here is only present on the Study Search page, which might make that page the best place to start in finding your desired cell type/tissue.
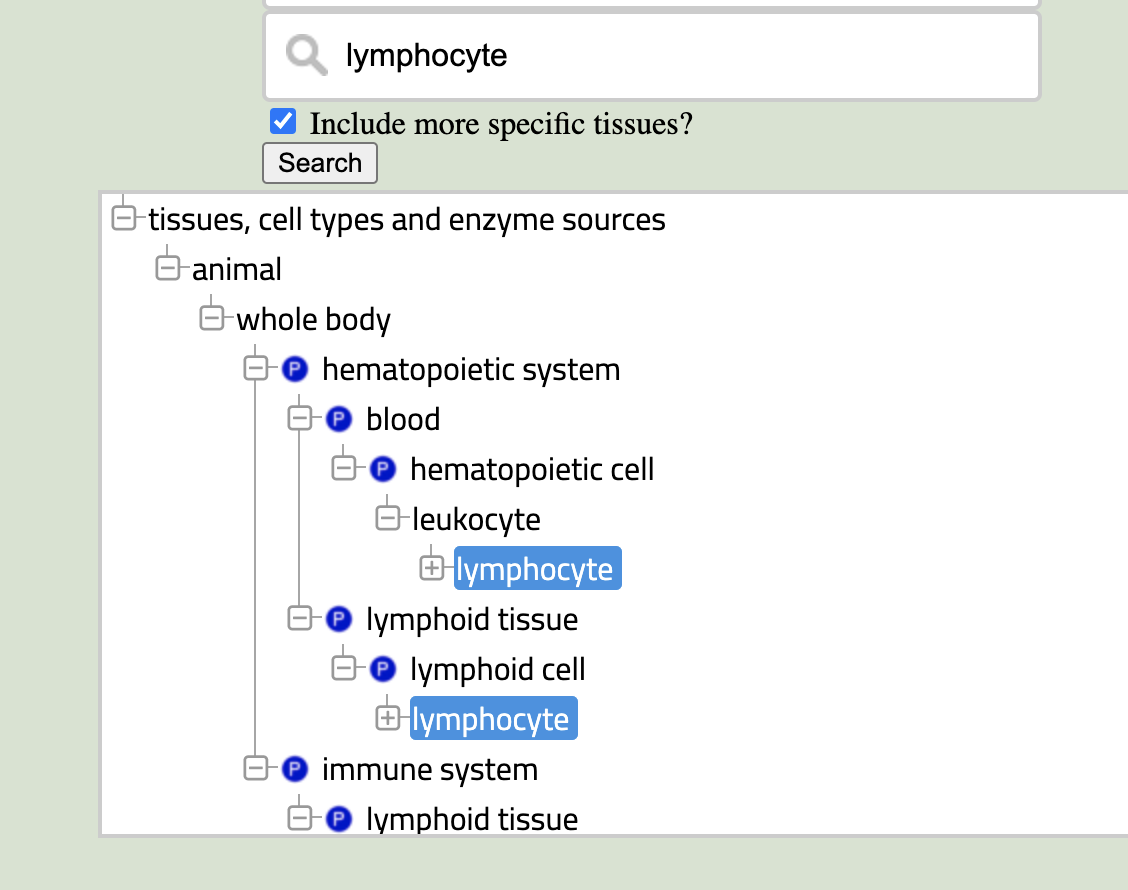
It can be challenging to figure out the exact name to use in the BTO. A good example is trying to search for "B cell" – absolutely nothing related to B cells pops up in the search box. If you can't find the term you're looking for, search for a more general term. In this case, I would try "lymphocyte" or maybe even "blood". Once you've selected the more general term, click the "Show Tissue Tree" link. You should see something similar to the image on the right. From here, you can navigate in the tree until you find the term you need (in this case, "B-lymphocyte" is a direct child of "lymphocyte"). Click the term in the tree, and it will be selected in the searchbox as well.
A common feature of ontologies is that terms can have multiple parents – a lymphocyte is both a leukocyte and a type of lymphoid cell. The tree browser shows you all the places your term exists in the hierarchy. Don't worry, though, the terms (and all of their children) are identical. It doesn't matter which of them you click on or expand.
BTO does include terms for some of the most common cell lines, but it is not at all comprehensive. Rather than using specific cell line terms (like "A-549 cell") for some cell lines and more general terms (like "non-small cell lung adenocarcinoma cell line") for others, VExD uses the more general term for all cell lines. If you want to search VExD for a specific cell line, use the suggestion box to find it. Then click "Show Tissue Tree" and select the immediate parent of your cell line.